TLDR: Wednesday Watchlist at the bottom
Thursday Watchlist Results:


Let’s talk about the past few days. On Wednesday, I wrote about some of the movement we might see:
“There is indecision in the market with swings up and down, up and down. Neither is winning out and we continually see the bullish to bearish, and back again, type patterns.”
Since last Friday, this has been playing out and we saw it again today. At the open, the movement was positive and it looked like we were in for a positive day. The market reacted positively to NVDA earnings and pulled most of the broader market upwards. However, the move was short-lived and we grinded down until about midday when the market decided it was time to grind back up. This type of movement is extremely difficult for option day traders.
As options traders, we are always limited by time. When we get choppy grinding type movement, it not only kills volatility premiums but also the time premiums. Many times you can see a stock price move in your favor only to see the option price not move or even go down in some cases!
I’ve said this off and on over the past 6 months, these market conditions are the hardest we’ve seen in over a decade. I don’t think that is hyperbole. We old dudes, who have been around for the dot-com bust, the global financial crisis, and now post Covid have some battle wounds. I can tell you trading in fast, crazy markets is exponentially easier than the markets we are dealing with currently.
Don’t beat yourself up if you are struggling. It’s tough out there. Try and control your risk and understand you are learning a lot right now. If you can get thru this market, you should be able to get thru any market.
Friday’s watchlist is relatively small. The simple reason is the chop we are dealing with. Stocks need more time to make clean set ups. With all the back and forth, charts get messy quick.
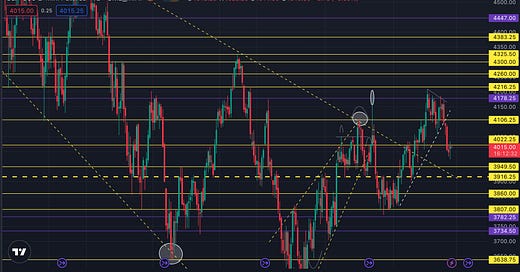
#ES_F S&P500 Futures
Upside: 4080, 4050, 4020*, *4100-4125*, **4180**,4215
Downside: 4000, 3980-3975, 3950, 3915*
Overall, things still aren’t looking great in the broader market on the daily chart. We need to start making a push and back toward 4100 if we are going to continue higher away from the major downtrend line from all time highs. The weekly chart is still intact with higher highs and higher lows, but with more negative movement that could get wiped out soon.
My bias is still neutral and choppy. The doom and gloomers will say the same patterns are going to repeat. In the past year or so, every time we try and push higher and fail, we see a precipitous drop. I think we are still too early to tell. We have some wiggle room down to 3900-3915 plus we don’t know how today’s green candlestick will play out.
I think we still need 4-5 more days and, possibly, a few weeks before we have a clearer understanding of where the market heads. Also, we may live in a big choppy world for a while. What if we chop around from 3900-4200 for the next few months (or longer)?
For tomorrow, I want to see if the positive movement continues and if we get back over 4050 and set up for a 4100 test. If the upward movement today can be sustained, we should expect the bears to step in and try and push things back under 4000 and stay there. Simple things to look for, are higher highs and higher lows showing up, or lower lows and lower highs? Are breakouts failing or are they running? Little breadcrumbs help give us an idea of where things can head.
To the downside, if #ES_F loses 4000 again, 3975-80 will be the next stop almost guaranteed. I want to see how 4000 and then 3975 area is handled before loading the boat and going full blown short on everything.
SPY 0.00%↑
Upside: 403, 407, 410-411*, 417, 420, 429, 436
Downside: 400*, 397, 393, 390*, 386
Trade Idea: 404c>403
The E-Mini and SPY are moving mostly in lockstep right now. Not much needs to be added for SPY. The one thing to keep an eye on is how 390-393 are handled if we see a big drop. That will line up with both major support lines as well as the major downtrend line from all time highs. Those price levels are the last stop for keeping this bull run going.
QQQ 0.00%↑
Upside: 297*, 302-303, 307, 310, 313, 317
Downside: 293, 290, 286
Trade Idea: 299c>297
The NASDAQ is still looking cleaner than the S&P500. Further, the overall pattern on the daily chart continues to look positive. With this pullback off the double bottom or “W” type bottom if things can start moving higher out of this channel, that would be very positive. Tomorrow, we could see a break out of the channel and test 303 area. Ideally, we get a nice pop out of the channel, a push towards 303, then we close over 300 and above the channel. I feel that would give us the cleanest looking setup for more upward movement next week.
If price falls out of the channel to the downside, there is not a ton of support until 285-286 area. Losing 293 tomorrow would be bearish and we would probably see a sizable drop on the S&P500 as well.
Price could just float around in limbo in the middle somewhere chopping us all to bits. It’s tough to say how to handle the chop. Does it chop in a small range? Big range? Do a slow grind in one direction then the other? If there are no clear answers on the type of market we are in, I usually sit out and wait for things to become easier to trade.
AAPL 0.00%↑
Trade Idea: 155c>150 3/3 expiration
All doom and gloom till its not? All the bears thought losing 150, falling out of the bull pennant, and falling below the steep rising trendline would be end of days for Apple. Not so fast. While we did see major pushes down the past few days, Apple held and has come back to test 150. For tomorrow, if we can back over 150, the price action will begin to look like a failed breakdown and we could push much higher. I am looking at next’s week expiration due to it being Friday and the bigger move to get the call in the money due to the lack of extra strikes.
On the downside, you could look at going short under Wednesday’s lows at 147.16. I don’t love a short trade for Apple unless we see lots of negative sentiment and downward movement.
BA 0.00%↑
Trade Idea:202.5p<203.5 (or 203)
Can also take 200p<203 with 3/3 expiration
Boeing is getting hammered after hours on production halt news for their 787. Will tomorrow finally be the day we work out of this flag? The upside breakouts have failed 3-4 times while the downside has maintained its clear support level. Typically when that happens, if the side that is holding cleaner breaks, then price continues in that direction. That is was I am betting on for tomorrow.
Either this week’s or next week’s contract can work. For a little more safety, next week is the better, safer option. Depending on how premiums act at the open, I’ll decide then what contract to take.
META 0.00%↑
Trade Idea:180c>173.7 3/3 expiration
On Watch<170
Meta has been on the verge of breaking out higher as well as breaking down back into the gap. I like it better for the upside. There is an ugly cup n handles type formation if we use the latest falling wedge as the “handle”. Does this make the formation more bullish if we break out of the falling wedge? Doubt it. I think it’s more likely the falling wedge plus the strong support around 172 has created a launching pad. But, there is a big gap staring right back at us. Meta’s price has attempted to fall back into the gap a few times and failed at doing so each time. Again, more a product of the strong support from the choppy channel back in June thru September 2022.
I am not opposed to a downside trade on Meta. But, given that price has failed to break lower the past few days, I want to give it some time and understand how the broader market is fairing till I jump in short. Meaning, if the broader market is showing signs of strength and holding up, most likely, I won’t take a short trade. I want to see weakness in the market PLUS weakness in Meta to go short.
ROKU 0.00%↑
On Watch: 64p<65 or backtest hold at 66 take 67c
After the big post earnings run up, we've seen a good sized pullback but not quite filled the gap. Below 65, and I think the gap fills. If that were to happen, it wouldn’t be a huge move, however, 1 point plus should give us 100% on the trade.
I also want to think about 66 holding up as a backtest support area to go long. But Dino, how do I know to go short or long? Base it off the price action both locally with a specific ticker as well as the broader market. In Roku’s case, we want to see some sort of bottoming formation or strong support hold around 66, then we can think about going long. However, if price is going straight down and its price blasts straight thru 66, that would be more negative and I would lean towards looking short under 65
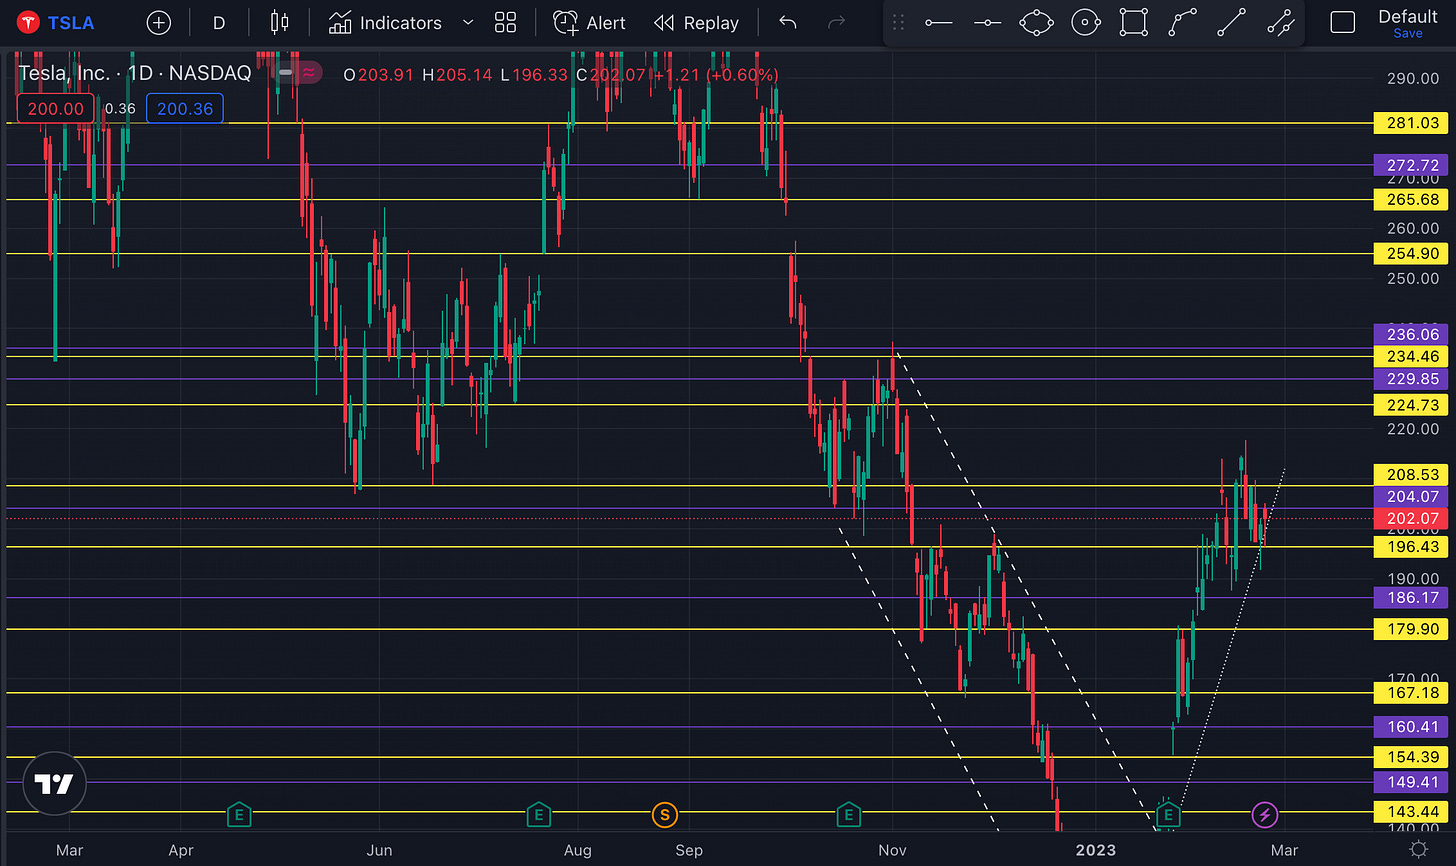
TSLA 0.00%↑
Trade Idea: 210c>205
Or Backtest trade idea: 197 holds take 202.5c
Tesla is still holding over the steep rising trendline off the bottom from the beginning of the year. Until that line breaks with conviction, I feel better about taking long trades. For tomorrow, 197 has acted as strong support the past few days and that area has shown resilience. If the market looks to be holding up and not rocketing lower, a backtest trade around 197 should do the trick. If it doesn’t look like the price will get down to 197, you could go early at 198, but I won’t pay much more than that. Further to the upside, I like it over today’s high around 205. Over 205 looks good for a push up to 210. If you need to take a lower risk trade, think about looking at next week’s 3/3 expiration strikes.


Thanks for the words of encouragement. I’m relatively new (3 years). I was asking myself a few weeks ago. If markets have always been this difficult to trade